FIG. 01
RECORD DATA
Category
Electronics
DATE
The scenario we run into most often on a multirotor's first flight goes like this: the aircraft lifts off, it holds a hover, but the throttle stick is already sitting near the top of its range. The moment a light breeze shows up, the autopilot has no headroom left to correct with, the motors run hot, and flight time comes in at half of what was predicted. This is not a tuning problem. It means the thrust budget was set up wrong back at the design table.
Start with two definitions. AUW (all-up weight) is the aircraft's total flight-ready mass: airframe, motors, ESCs, battery, autopilot, companion computer, camera, wiring and payload included. Every 200 grams left out on paper comes back at you through the throttle curve at the end of the flight. T/W (thrust-to-weight ratio) is the maximum thrust all of the motors can produce together, divided by AUW.
In this post we cover how to pick a T/W target, how to actually read a motor thrust data sheet, and a step-by-step selection calculation for a 5 kg quad. Every number here comes from a real manufacturer table; none of them are invented.
Choosing a T/W target
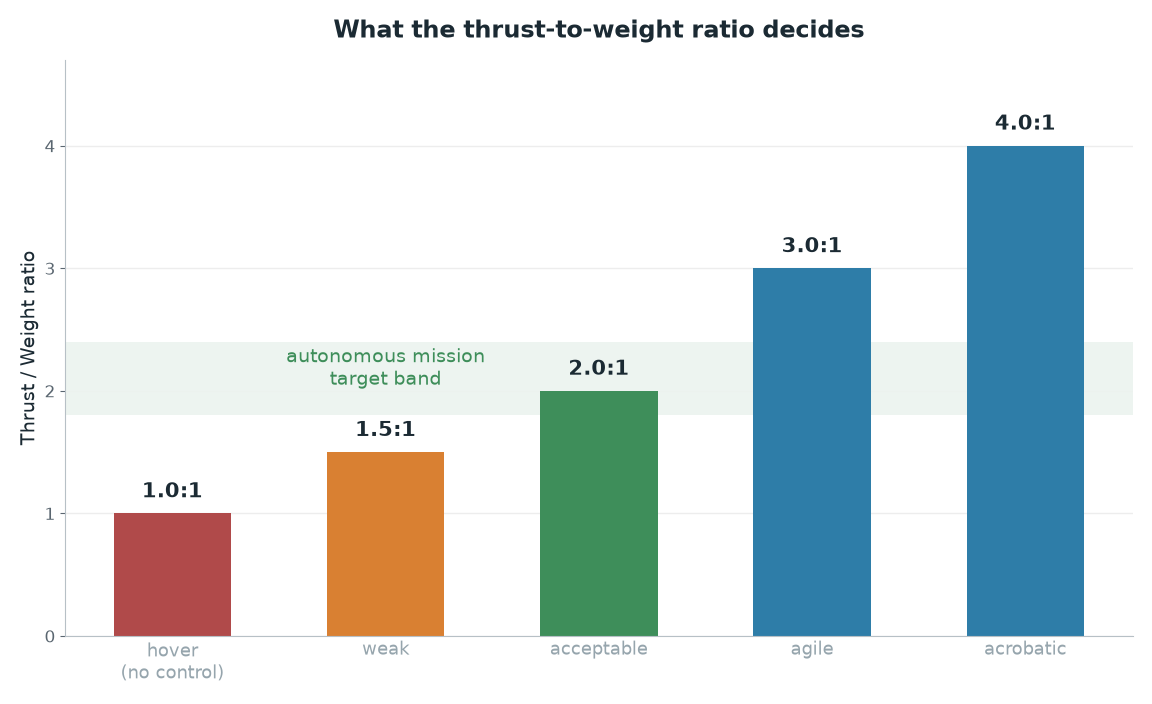
A T/W of 1.0 means the motors can just barely carry the aircraft's own weight. At that point the autopilot has no margin to correct with: to roll, one motor has to add thrust, and there is nothing left to add.
T/W | Behavior | When to choose it |
|---|---|---|
1.0 | Hover on paper only; zero control margin | Never |
1.2 – 1.8 | Limited maneuvering, high throttle, hot motors | Avoid; eCalc flags this band "yellow" |
2.0 – 2.5 | Acceptable control authority, margin for wind | Camera and mission platforms: our target |
3.0 – 4.0 | Aggressive acceleration, sharp maneuvering | Racing, aerobatics, missions that need sudden evasion |
The logic behind 2:1 is simple: if each motor only uses half of its capacity in a hover, the other half is free for wind correction, altitude recovery and roll/pitch moments. ArduPilot's VTOL documentation points at the same 2:1–3:1 range as a target. On a camera-carrying aircraft, pushing up to 4:1 costs you heavier motors and lower efficiency; on our SUAS 2026 aircraft we aimed for somewhere around 2.5.
The core formulas
Quantity | Formula | Notes |
|---|---|---|
|
| Weight (N), g = 9.81 m/s² |
|
| Total thrust required (kilograms-force) |
|
| Maximum thrust per motor, n = number of motors |
|
| Hover thrust per motor |
|
| kg/m², D = propeller diameter (m) |
|
| Minutes |
Example: 5.0 kg AUW, 4 motors, target T/W = 2.0.
T_total= 5.0 × 2.0 = 10.0 kg
T_motor= 10.0 / 4 = 2.50 kg = 2500 g → the value to look for on the motor's data sheet
T_hover= 5.0 / 4 = 1.25 kg = 1250 g → the hover point
So we go shopping with "at least 2500 g of thrust per motor" in hand, but what we actually care about is the throttle setting and the current at which that 1250 g gets produced.
How to read a motor data sheet
Serious manufacturers never test a motor on its own; they test the motor + propeller + voltage triplet. Below are selected rows from T-Motor's test table for the MN5006 KV450 with a P15×5.0" carbon propeller on 6S (~23.5 V), taken from the manufacturer's product page as of 2026:
Throttle | Current (A) | Power (W) | RPM | Thrust (g) | Efficiency (g/W) |
|---|---|---|---|---|---|
45% | 4.20 | 99 | 4141 | 895 | 9.03 |
50% | 5.41 | 127 | 4528 | 1084 | 8.51 |
55% | 6.67 | 157 | 4887 | 1259 | 8.03 |
60% | 8.17 | 191 | 5239 | 1458 | 7.61 |
65% | 9.76 | 228 | 5573 | 1643 | 7.20 |
75% | 13.56 | 316 | 6219 | 2079 | 6.59 |
100% | 26.28 | 601 | 7682 | 3218 | 5.35 |
What the columns mean:
KV (450): the no-load rpm constant. Unloaded rpm is roughly KV × V = 450 × 23.5 ≈ 10575. Full throttle in the table is 7682 RPM, about 73% of that, which is the behavior you expect from a loaded propeller. Bolting a large propeller onto a very high-KV motor drives it right off the data sheet.
Efficiency (g/W): grams of thrust per watt. It drops as throttle goes up: 9.03 at 45%, 5.35 at full throttle. This is the column that determines your flight time. eCalc's guidance treats 6 g/W and above in a hover as good.
Current (A): the input to your ESC, wiring and battery C-rating choices.
Temperature: the manufacturer publishes the test temperature as well; the motor case should never exceed 80 °C under any condition.
The same motor's catalogue also carries tables for the P14×4.8" and the P17×5.8". Change the propeller and every row changes, which is why "picking a motor" isn't really a thing. You pick a motor-propeller pair.
Working it through: a 5 kg quad
1. Is the motor big enough? 4 × 3218 g = 12,872 g = 12.87 kg. T/W = 12.87 / 5.0 = 2.57. Above target, accepted.
2. The hover point. We need 1250 g per motor. The table gives 1259 g at 55% throttle: 6.67 A and 157 W.
3. Hover current and power.
I_motors= 4 × 6.67 = 26.7 A
P_motors= 4 × 157 = 628 W → 628 / 5 kg = 126 W/kg
I_avionics≈ 50 W / 23.5 V ≈ 2.1 A (assumes Jetson + gimbal + FC + telemetry)
I_total≈ 28.8 A
126 W/kg sits below the ~150 W/kg that eCalc quotes as typical for a hover, so we are on the efficient side of the line.
4. Flight time. With a 6S 10 Ah LiPo, using 80% of the pack (to stay above 3.5 V per cell):
t= (10 Ah × 0.80) / 28.8 A × 60 = 16.7 minutes (hover)
Any flight with real maneuvering in it comes in under that; the hover number is an upper bound.
5. Iteration. Move up to a 16 Ah pack and AUW becomes ~5.7 kg, which pushes hover thrust to 1425 g per motor (59% throttle, ~7.9 A). New endurance ≈ 22.7 minutes. We added 60% more capacity and got 36% more time. That diminishing return is the natural brake on battery sizing.
6. Battery C-rating. Hover at 28.8 A → 2.9C on a 10 Ah pack. Full throttle at 4 × 26.28 = 105 A → 10.5C. Pick a pack whose continuous discharge rating covers that comfortably; you never design against the "burst" number printed on the label.
The "hover happens at 50% throttle" myth
Propeller thrust rises with the square of rpm: T = k_T · ρ · n² · D⁴. Rpm, in turn, tracks the throttle command roughly linearly. The result: half the thrust does not land at half the throttle.
Check it against the table above. Maximum thrust is 3218 g; half of that is 1609 g. That value lands at 65% throttle (1643 g), not 50%. In other words, an aircraft with T/W = 2 hovers at roughly 64% in terms of the raw throttle command going to the ESC.
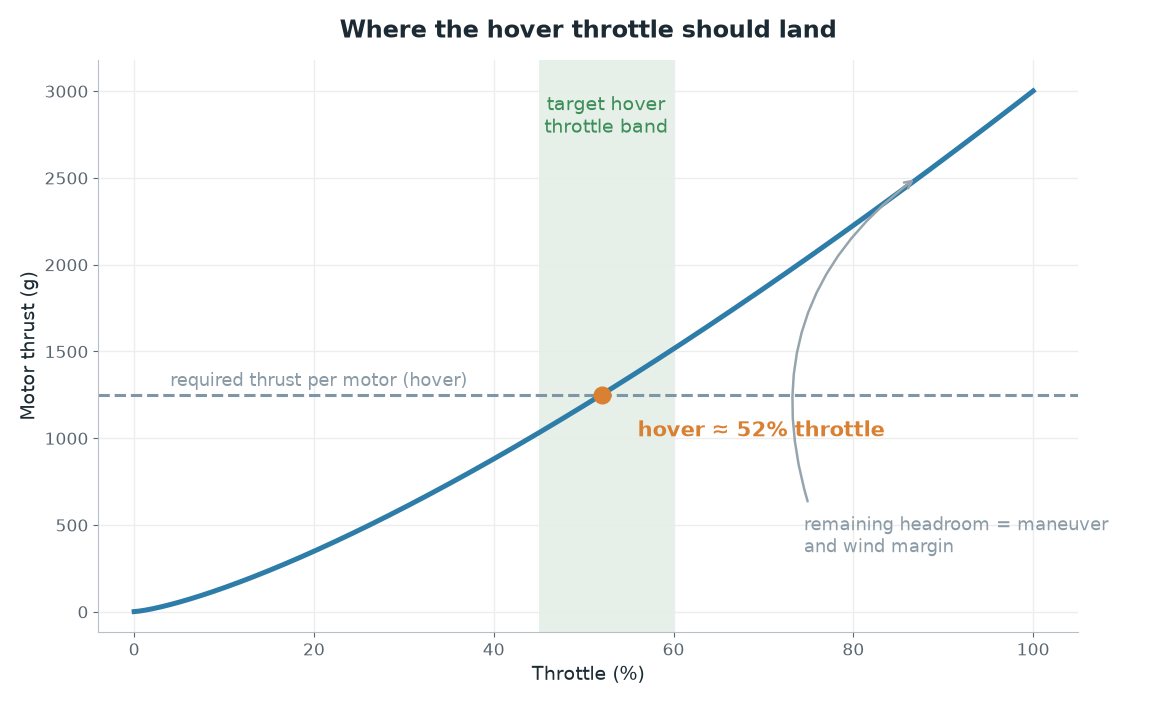
So why does ArduPilot report MOT_THST_HOVER in the 0.2–0.6 band? Because ArduPilot linearizes that quadratic curve with MOT_THST_EXPO (0.65 by default); the "throttle" the autopilot sees is a thrust fraction, not a stick position. Confusing the two was the mistake we made most often when comparing the data sheet against our logs.
One note: some ESCs do their own linearization internally. ArduPilot's documentation says that in that case the 0.65 default can cause stability problems, and may need to be pulled down into the 0–0.2 range based on thrust stand measurements.
Propellers: diameter, pitch, disk loading
Diameter (D) drives thrust to the fourth power, and it is the real source of efficiency. A larger propeller produces the same thrust by accelerating a lot of air a little, instead of a little air a lot.
Pitch is the distance a propeller theoretically advances in one revolution. High pitch pays off at forward speed and raises current in a hover. To guard against stall, eCalc recommends keeping the pitch/diameter ratio below 2/3: for a 15×5.0 that is 5/15 = 0.33, so no problem there.
Disk loading is the weight carried per unit of rotor area, and it sets hover efficiency directly:
A_disk= 4 × π × (0.381 m)² / 4 = 0.456 m²
Disk loading= 5.0 / 0.456 = 11.0 kg/m²Ideal induced power =
T^1.5 / sqrt(2 · ρ · A)= (49.05 N)^1.5 / sqrt(2 × 1.225 × 0.456) ≈ 325 W
The measured electrical hover power was 628 W. The gap between the two is profile losses plus motor and ESC efficiency: roughly 52% overall, which is reasonable for this class. That comparison is a fast way to find out whether a data sheet is physically consistent.
Altitude and temperature: the column the tables don't print
Thrust is directly proportional to air density. You can work density out from the ideal gas law:
ρ = p / (R · T)—R= 287 J/(kg·K),Tin kelvin
Conditions | Air density |
|---|---|
Sea level, 15 °C | ρ = 1.225 kg/m³ |
1500 m, 35 °C | ρ = 84554 / (287 × 308.15) = 0.956 kg/m³ → 78% |
Under those conditions maximum thrust drops from 12.87 kg to about 10.0 kg; T/W falls from 2.57 to 2.01 and hover throttle shifts upward. If you are going to fly a high field on a hot summer day, run the numbers with the density at the field, not with sea-level density.
Traps we keep seeing
Reading a single line of the data sheet. "3.2 kg of thrust" is the marketing line; it holds at full throttle, pulling 26 A, at 5.35 g/W. The line you will actually live on is the hover line.
Hovering close to full throttle. Beyond running out of control margin, motor temperature and ESC current sit at their limits continuously. If the motor case goes past 80 °C, the design is wrong.
Motor-propeller mismatch. A large propeller on a high-KV motor pushes current straight off the data sheet. The symptom: abnormal heating at normal thrust, and falling g/W.
Undercounting takeoff weight. Wiring, connectors, tape, guards, mounting hardware: all of it goes on the scale. On our aircraft, the airdrop servo mechanism got left out of the first calculation.
Ignoring airframe effects. Data sheets are measured in open air with a single propeller. Arms, fuselage and rotor-to-rotor interaction all cut thrust; measure that loss on your own aircraft with a thrust stand.
Forgetting battery internal resistance. Cell voltage sags under load, so the same thrust demands more current, and your endurance estimate comes out optimistic.
Safety
All of this involves high currents and spinning blades. Start bench tests with the propellers off; if you are going to test with propellers on, bolt the aircraft to a fixed stand, stay out of the plane of rotation and wear eye protection. A full-throttle test can involve currents above 100 A, so size your wire gauge and connectors accordingly, and never touch the connectors by hand while a measurement is running. Don't take LiPo packs below 3.5 V per cell, don't use a swollen pack, and charge and store them inside a fireproof container. Always configure the autopilot's battery failsafe thresholds before you fly.
The practical summary
Weigh the AUW first; don't estimate it. The entire calculation chain starts from that one number; if it's wrong, nothing downstream means anything.
Target T/W 2.0–2.5 for a mission platform. Below that leaves you no control margin, above it just adds weight you don't need.
Look for the hover line on the data sheet, not the maximum-thrust line. The current and the g/W on the row closest to
AUW / number of motorsare what determine your flight time.Keep throttle command and thrust fraction separate. Thrust rises with the square of rpm; 50% thrust ≈ 65% raw throttle. In ArduPilot,
MOT_THST_EXPOcloses that gap.Redo the calculation for field conditions. Altitude and temperature lower density; a T/W of 2.5 at sea level can fall to 2.0 on a hot, high field.
Once these steps are done, the autopilot side is next; reviewing whether the hover numbers actually hold up in SITL and Gazebo simulation before the first flight cuts down the number of batteries you burn at the field.